Our Values
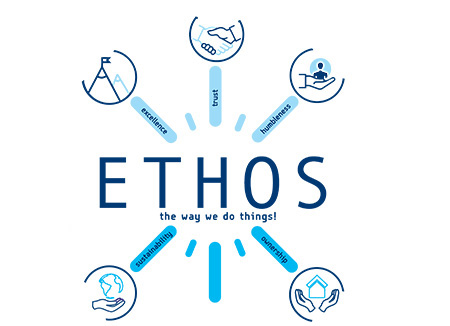
There is a word that transcends thousands of years. A word that takes us back to our ancient roots - ETHOS. At Sarantis Group, we have co-created our own definition of ETHOS across our countries, living our values everyday, in the way we think, we act together and with all our stakeholders.
We believe in the power of our people, and we keep building our future together living everyday with Ethos – because this is what we stand for…
“We are a Team with ETHOS”
Watch the video
“We are a Team with ETHOS”
The Group
Our Brands
Sustainability
Investor Relations
News & Media
Careers in Sarantis
Group Sarantis Group
-
Who we are
-
What we do
-
Our People
Our People-
Career opportunities
-
Sustainability
Sustainability -
Investor Relations
Investor Relations-
Financial Results
-
Our share
-
Investors' Information
-
Investor News & Updates
-
News & Media
News & Media
Please download the attached file for Financial Results Analysis.
PRESS RELEASE
MAJOR HIGHLIGHTS
- Financial results of Gr. Sarantis Group were in line with the Management’s strategy.
- Turnover growth of Gr. Sarantis Group reached 8%.
- Foreign markets’ contribution to total turnover has been steadily rising, settling at 44.60% by the end of first half 2006.
- The Management targets stronger expansion for the Group in the markets of Ukraine, Turkey, and Russia, via intensive promotion and advertising activities, as well as the introduction of new products and a larger product portfolio.
FINANCIAL RESULTS
Consolidated turnover of Gr. Sarantis Group settled at EUR 107.36 million in the first half 2006 as compared to EUR 99.55 million in the same period last year, posting a growth of 7.84%.
Earnings before taxes settled at EUR 15.44 million during the first half 2006 versus EUR 12.73 million last year, demonstrating a rise of 21.32%.

Earnings before interest and taxes (EBIT) settled at EUR 14.18 million in the first half 2006, versus EUR 13.97 million in the same period last year, posting a growth rate of 1.45%.
Earnings before interest, taxes, depreciation and amortization (EBITDA) demonstrated a similar performance, rising by 1.24% to EUR 16.01 million in the first half 2006 versus EUR 15.81 million in the same period last year. The limited growth rate realized in EBITDA was due to high installation expenses in the Group’s new geographic markets, as well as the rising promotion and advertising expenditures in the international markets.
Earnings after taxes and minorities (EATAM) settled at EUR 11.14 million in the first half 2006, posting a growth of 13.03% as compared to the same period last year.
BREAKDOWN PER BUSINESS ACTIVITY
Consolidated turnover breakdown per business activity is now reported through 4 categories, which constitute Gr. Sarantis Group’s organic growth drivers according to the Management’s new strategy. These categories are fragrances & cosmetics, household products, health care products and strategic alliances. The outcome of the Group’s new strategy and specifically the decision made by the Management to report the organic growth driver under four categories is already reflected in the financial results of the current year.
The most interesting performance was realized in the Group’s own products, especially in fragrances & cosmetics and household products.
Fragrances & cosmetics represent 38.86% of total turnover, followed by household products, 38.08%. Strategic alliances’ revenues correspond to 13.73% of total turnover, with health & care products capturing a stake of 9.33% out of the total. It is worth mentioning, that the strongest growth came from the health & car products (+22.22% as compared to the first half 2005), with the second largest growth seen in fragrances & cosmetics, 20.19%.
As far as EBIT is concerned, fragrances & cosmetics were the greatest contributor, with 34.77%, followed by strategic alliances, with 33.03%. Household products participate with 22.43%, followed by health & care products with 9.77%.
BREAKDOWN PER GEOGRAPHIC MARKET
Gr. Sarantis Group’s sales in the Greek market represent 55.40% of total consolidated turnover, whereas the remaining part of 44.60% or EUR 47.88 million concerns the Group’s sales in the international markets. It is worth mentioning that as compared to the first half of 2005, sales of Gr. Sarantis Group in the international markets have achieved growth of 23.62% in the current period, whereas revenues from the Greek market have decreased by 2.21%. Furthermore, it is important to note that despite the Greek market’s maturity, if the lack of revenues from PET retail activities and services to Estee Lauder JV during first half 2006 is taken into consideration (which corresponds to total contribution of EUR 4.83 million – or EUR 3.13 million from PET and EUR 1.7 million from Estee Lauder JV), then revenues generated in Greece demonstrate a growth of 5.72% to EUR 64.3 million.
Next to Greece, the strongest contributor in revenues has been Poland (EUR 20.71 million), followed by Romania (EUR 13.75 million), Bulgaria (EUR 5.87 million), Serbia (EUR 3.22 million), Turkey (EUR 1.68 million), Czech Republic (EUR 1.66 million), FYROM (EUR 0.66 million), Ukraine (EUR 0.17 million) and Hungary (EUR 0.17 million). During the first half 2006, Czech Republic achieved the highest growth (+41.22%), followed by Serbia (+29.09%), Bulgaria (+26.63%) and Poland (+22.07%).
 GR. SARANTIS GROUP - FINANCIAL RESULTS FOR THE FIRST HALF 2006
(226.9KB)
GR. SARANTIS GROUP - FINANCIAL RESULTS FOR THE FIRST HALF 2006
(226.9KB)

Issuance of Tax Certificate for the Fiscal Year 2024
The company GR. SARANTIS S.A., in compliance with the provisions of paragraph 4.1.1 of the Athens Exchange Regulation (Rulebook) and article 17 of Regulation (EU) No 596/2014 of the European Parliament and of the Council of April 16th 2014, announces that, following the completion of the tax audit for the financial period 2024 (fiscal year 2024) which was carried out by the certified auditors of the Company, in accordance with the provisions of article 78 law 5104/2024, the relevant tax certificate has been issued with an “unqualified” opinion.
More
Contact
SARANTIS Group
26, Amaroussiou - Halandriou Street
151 25 Maroussi, Athens, Greece
Tel: +30 210 6173000
Fax: +30 210 6197081
e-mail: group-info@sarantisgroup.com
Connect with us
We're always looking to connect with those who share an interest.Management of Sarantis Group encourages everyone to Speak Up and report any inappropriate behaviour or practice. SARANTIS Group Speak Up
Stay Tuned
Sign up to receive our latest news update!
Sarantis Group © 2026. All rights reserved.
Terms Of Use
| Privacy Policy
| Cookies Policy
| Digital Assistant Terms of Use
Website Design & Development by

