Our Values
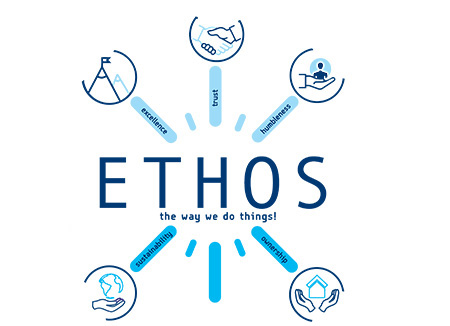
There is a word that transcends thousands of years. A word that takes us back to our ancient roots - ETHOS. At Sarantis Group, we have co-created our own definition of ETHOS across our countries, living our values everyday, in the way we think, we act together and with all our stakeholders.
We believe in the power of our people, and we keep building our future together living everyday with Ethos – because this is what we stand for…
“We are a Team with ETHOS”
Watch the video
“We are a Team with ETHOS”
The Group
Our Brands
Sustainability
Investor Relations
News & Media
Careers in Sarantis
Group Sarantis Group
-
Who we are
-
What we do
-
Our People
Our People-
Career opportunities
-
Sustainability
Sustainability -
Investor Relations
Investor Relations-
Financial Results
-
Our share
-
Investors' Information
-
Investor News & Updates
-
News & Media
News & Media
PLease download the attached file for Financial Results Analysis.
PRESS RELEASE
- The Group’s new expansion strategy delivers returns.
- Turnover: increase by 8.93%, to EUR 48.83 million.
- Earnings after Taxes and after Minorities (EATAM): increase by 27.20% to EUR 4.47 million.
- Eastern European Markets: Poland and Romania were the largest contributors; however Bulgaria, Serbia and Czech Republic posted the strongest growth rates.
The consolidated turnover of Gr. Sarantis Group settled at EUR 48.83 million during the first quarter of 2006, posting a growth rate of 8.93% as compared to the same period of 2005, when consolidated turnover had settled at EUR 44.82 million.
Earnings before taxes on Group level reached EUR 6.10 million during the first quarter 2006, versus EUR 4.89 million in the corresponding period of 2005, posting an increase of 24.85%.
Earnings before Interest and Taxes (EBIT) settled at EUR 5.65 million during the first quarter, posting a growth of 1.86% on annual basis. The relatively small growth was mainly due to the especially high marketing support expenses and increased start up cost regarding the new markets of Gr. Sarantis Group in Eastern Europe.
Earnings after Taxes and after Minorities reached EUR 4.47 million during the first quarter 2006, higher by 27.20% as compared to the same period of 2005.

Analysis per Business Activity
Looking at the consolidated turnover of Gr. Sarantis Group, there are clear benefits from the Management’s decision to classify the Group’s organic growth drivers into four categories. These four categories are the following: mass-market cosmetics, household products, health care products, and strategic alliances. A special note must be made with regard to Group’s own product portfolio, which generates the majority of revenues in the categories of mass-market cosmetics and household products.
By analyzing the above-mentioned strategic growth drivers, we observe that household products represent the largest stake, 37.82%, of total turnover, with mass-market cosmetics representing 36.63% of the total. It is noted that own products dominate the above two categories. On the other hand, health care products posted the strongest growth rate, 22.79%, on annual basis. This growth resulted from product portfolio restructuring, distribution network expansion, and stronger penetration in the Eastern Europe.
Mass-market cosmetics participated with 43.06% in the total Earnings before Interest and Taxes (EBIT) of Gr. Sarantis Group, with household products accounting for 27.01% of total EBIT. On the other hand, health care products posted the strongest growth rate, 41.53%, on annual basis, with mass-market cosmetics achieving the second largest growth, 37.01%. With regard to the EBIT contraction in household products, it was due to stronger marketing support expenses within the first quarter.
Analysis per Geographic Market
Despite signs of maturity in the domestic market, Greece remained the most important contributor in total consolidated turnover, posting however a slight drop as compared to the first quarter of 2005. Of course the drop was also related to the fact that no revenues from the PET products wholesale sector (of € 1.2 million) and from services to Estee Lauder JV (of € 1.1 million) were recorded during the period.
Therefore the Greek market represented 54.86% of total consolidated turnover in the first quarter of 2006 versus 59.83% previously. Next to Greece was Poland with contribution of 18.14%, Romania with 13.71% and Bulgaria with 5.29%. It is worth noting that the strongest growth rates on annual basis were realized in Serbia (+27.24%), Bulgaria (+21.90%) and Czech Republic (+20.44%). Finally, total contribution of Eastern Europe in the consolidated turnover settled at 45.14% from 40.17% in the previous period, in line with the Group’s strategy in terms of export orientation.
The analysis of the consolidated earnings before interest and taxes during the first quarter of 2006 evolved along with the turnover, confirming the declining contribution of the Greek market in total consolidated EBIT. Specifically, with regard to the Greek market, earnings before interest and taxes settled at EUR 5.11 million in the first quarter of 2006 versus EUR 5.26 million the same period last year, dropping by 2.93%. As far as Eastern European markets were concerned, consolidated earnings before interest and taxes reached EUR 0.54 million versus EUR 0.28 million in Q1 ’05, surging by 91.09%. Eastern Europe’s contribution to total consolidated EBIT rose to 9.55% from 5.09% previously.
 Financial Results Analysis
(246.4KB)
Financial Results Analysis
(246.4KB)

Issuance of Tax Certificate for the Fiscal Year 2024
The company GR. SARANTIS S.A., in compliance with the provisions of paragraph 4.1.1 of the Athens Exchange Regulation (Rulebook) and article 17 of Regulation (EU) No 596/2014 of the European Parliament and of the Council of April 16th 2014, announces that, following the completion of the tax audit for the financial period 2024 (fiscal year 2024) which was carried out by the certified auditors of the Company, in accordance with the provisions of article 78 law 5104/2024, the relevant tax certificate has been issued with an “unqualified” opinion.
More
Contact
SARANTIS Group
26, Amaroussiou - Halandriou Street
151 25 Maroussi, Athens, Greece
Tel: +30 210 6173000
Fax: +30 210 6197081
e-mail: group-info@sarantisgroup.com
Connect with us
We're always looking to connect with those who share an interest.Management of Sarantis Group encourages everyone to Speak Up and report any inappropriate behaviour or practice. SARANTIS Group Speak Up
Stay Tuned
Sign up to receive our latest news update!
Sarantis Group © 2026. All rights reserved.
Terms Of Use
| Privacy Policy
| Cookies Policy
| Digital Assistant Terms of Use
Website Design & Development by

